+ - 0:00:00
Notes for current slide
Notes for next slide

D3.js: Tell your stories interactively

François Charih

IEEE EMBS/CMBES Workshop Series

February 6th, 2019

Slides available here: http://charih.ca/workshops/d3-workshop/presentation.html

1 / 33

What is D3.js?

Data-Driven Documents

D3.js is an open-source Javascript library that provides a convenient interface for building data visualizations in the browser.

Created by Mike Bostock, a graphic designer at the New York Times.

1 / 33

What is D3.js?

Data-Driven Documents

D3.js is an open-source Javascript library that provides a convenient interface for building data visualizations in the browser.

Created by Mike Bostock, a graphic designer at the New York Times.

Why would I want to use D3.js?

2 / 33

Tell your story the way you want it told

We accumulate data that is larger in volume and complexity than ever before. Static plots are no longer enough to tell stories which are becoming increasingly complex.

3 / 33

Tell your story the way you want it told

We accumulate data that is larger in volume and complexity than ever before. Static plots are no longer enough to tell stories which are becoming increasingly complex.

Traditional plotting software (MATLAB, matplotlib, seaborn, etc.) allows you to create visualizations quickly, but leave little room for easy customization.

4 / 33

Tell your story the way you want it told

We accumulate data that is larger in volume and complexity than ever before. Static plots are no longer enough to tell stories which are becoming increasingly complex.

Traditional plotting software (MATLAB, matplotlib, seaborn, etc.) allows you to create visualizations quickly, but leave little room for easy customization.

With D3.js, you build you visualizations from the ground up. D3.js is:

  • Simple and declarative
  • Flexible: allows for interactivity, events, real-time plotting, etc.
  • Compatible with modern web standards
  • Modular
  • Extremely well-documented by a gigantic community
5 / 33

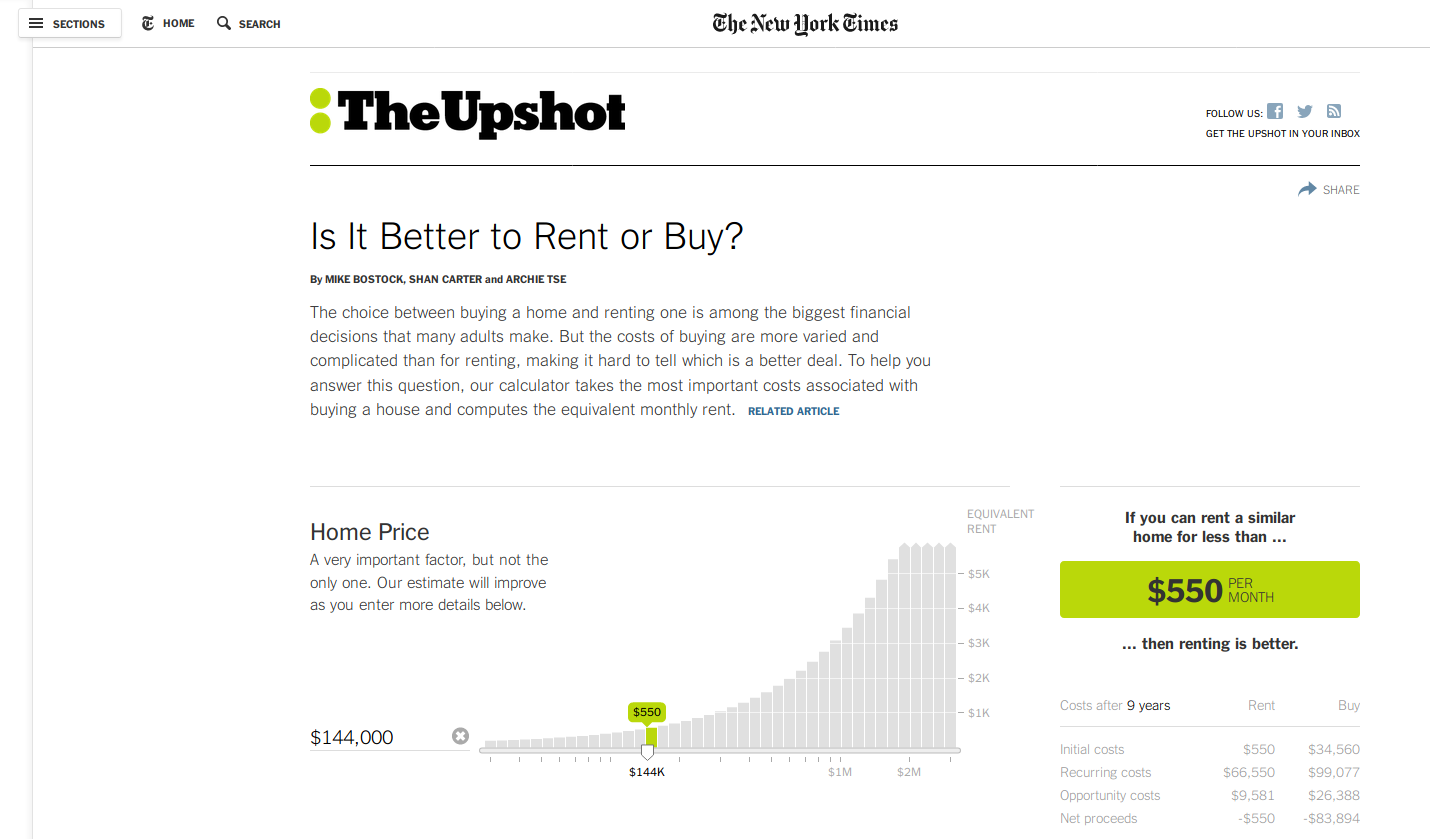
D3.js in action: rent or buy?

Visualization by Mike Bostock (D3.js creater/maintainer)
6 / 33

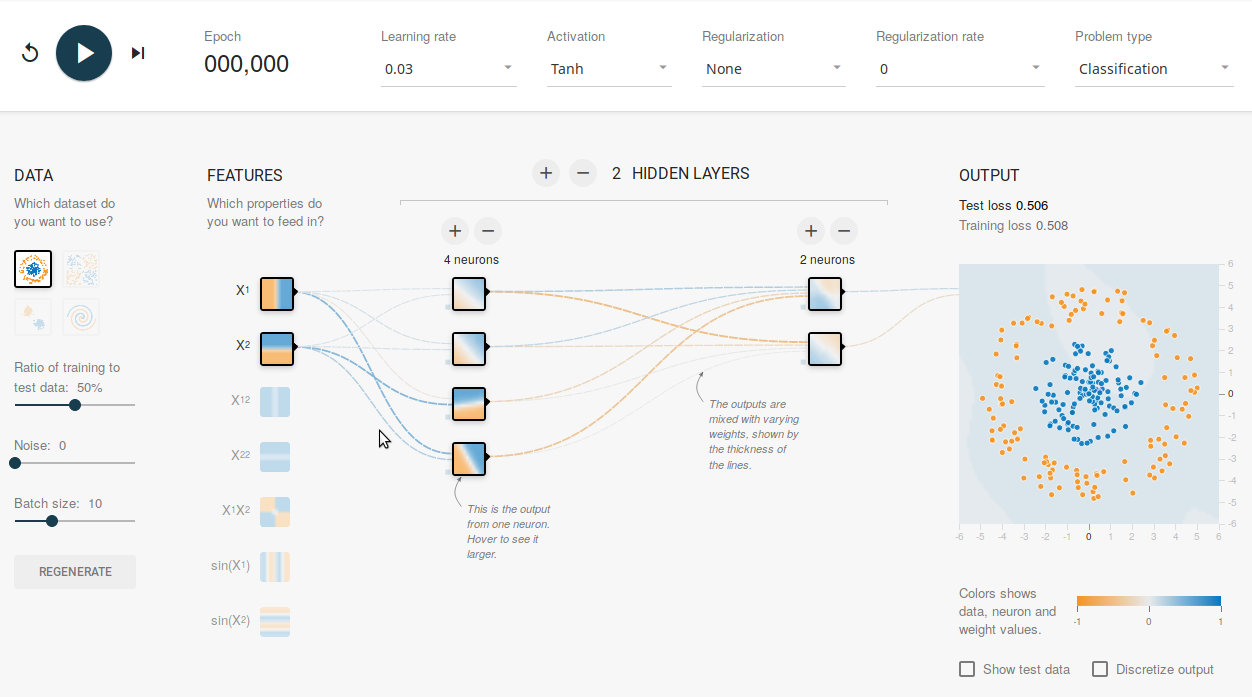
D3.js: The neural network playground
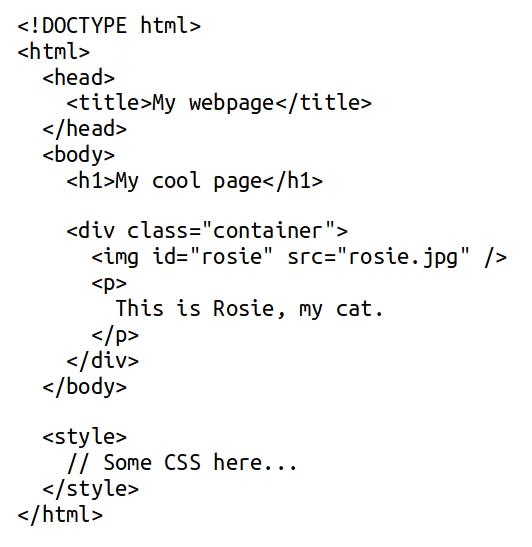
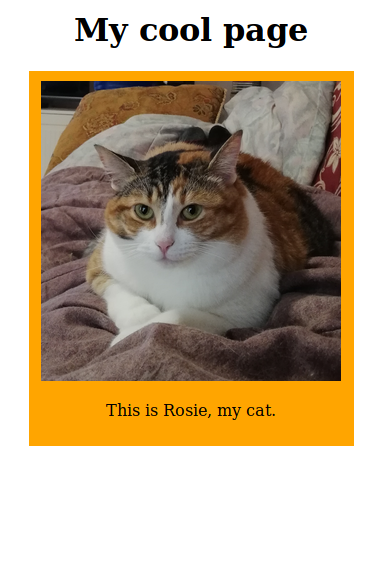
Neural Network Playground
7 / 33

D3.js in action: OMG PARTICLES

In this example, the center of the waves follows the cursor.

8 / 33

The web trifecta

D3.js is a JS library; usage requires some basic knowledge about how webpages are structured/built.

image/svg+xml HTML(content) CSS(style) Javascript(behavior)
9 / 33

HTML & CSS

The Hypertext Markup Language allows us to define the hierarchy of the content of a webpage. We refer to it as the DOM Tree.

10 / 33

HTML & CSS

The Hypertext Markup Language allows us to define the hierarchy of the content of a webpage. We refer to it as the DOM Tree.

11 / 33

Javascript is awesome

Javascript runs in virtually every browser: bust out the command line in your browser and you are set (not quite, but almost).

12 / 33

Javascript is awesome

Javascript runs in virtually every browser: bust out the command line in your browser and you are set (not quite, but almost).

Now, with Node.js, Javascript has become a scripting language, just like Python.

13 / 33

Javascript is awesome

Javascript runs in virtually every browser: bust out the command line in your browser and you are set (not quite, but almost).

Now, with Node.js, Javascript has become a scripting language, just like Python.

People now use Javascript as a general-purpose language to:

IMPORTANT NOTE
Javascript has its quirks, so use it with caution.
14 / 33

Javascript is everywhere

15 / 33

Javascript (ES6): the essentials

/* Declaring a variable */
var a = 0;
const b = 1;
let c = 2;
a = 5; // OK
b = 2; // ERROR
c = 1; // OK
/* Defining a function */
// Anonymous function (not useful on its own)
function(param1, param2) { return param1 + param2 } // old JS
(param1, param2) => param1 + param2 // ES6 (new JS)
// Named function
function add(param1, param2) {
return param1 + param2;
}
/* Callbacks */
function addAndPrint(param1, param2, callback) {
const sum = param1, param2;
callback(sum);
}
addAndPrint(5, 7, function(sum) { console.log(sum) }) // (old JS)
addAndPrint(5, 7, (sum) => console.log(sum)) // (new JS)
16 / 33

Javascript

Javascript is a language that allows us to modify the DOM Tree dynamically:

  • Styling
  • Event handling (click, buttons, sliders)
  • Animations
var paragraphs = document.getElementsByTagName("p");
for (var i = 0; i < paragraphs.length; i++) {
var paragraph = paragraphs.item(i)
paragraph.style.setProperty("color", "red", null)
}
Changing font color to red in Javascript
17 / 33

Javascript

Javascript is a language that allows us to modify the DOM Tree dynamically:

  • Styling
  • Event handling (click, buttons, sliders)
  • Animations
d3.selectAll("p").style("color", "red")
Changing font color to red with D3.js
18 / 33

Scalable vector graphics (SVG)

SVG is a "language" for vector-based graphics, as opposed to raster-based graphics. As such, it can be scaled to arbitrary sizes without loss in quality.

SVG has a similar syntax to HTML, but defined geometric elements: circles, rectangles, lines, paths, polylines.

<svg>
<line x1="100" x2="100" y1="50" y2="100" stroke="black" stroke-width="4" />
<circle cx="350" cy="50" r="40" stroke="green" stroke-width="4" fill="blue" />
<polygon points="200,10 250,100 160,100" style="fill:transparent;stroke:red;" />
</svg>
19 / 33

D3.js: drawing shapes

Technically, you could make static plots using only SVG, but that may be tedious. For e.g., what if I want to make 12 circles?

/* Store the circle coordinates in an array */
var circleCenters = []
var OFFSET = 25
for(var i = 0; i < 12; i++){
circleCenters.push(i*50 + OFFSET)
} // circleCenters = [25, 75, 125, ..., 575]
/* Add the 12 circles to your canvas */
d3.select('[id="#12circles"]') // Select the canvas
.selectAll(".circles")
.data(circleCenters)
.enter()
.append('circle') // Create the circles
.attr('r', 25)
.attr('cy', 25)
.attr('cx', function(pos, index) { return pos }) // Use the position bound to the circle
.style('fill', 'blue')
20 / 33

D3.js: drawing shapes

Technically, you could make static plots using only SVG, but that may be tedious. For e.g., what if I want to make 12 circles?

/* Store the circle coordinates in an array */
var circleCenters = []
var OFFSET = 25
for(var i = 0; i < 12; i++){
circleCenters.push(i*50 + OFFSET)
} // circleCenters = [25, 75, 125, ..., 575]
/* Add the 12 circles to your canvas */
d3.select('[id="#12circles"]') // Select the canvas
.selectAll(".circles")
.data(circleCenters)
.enter()
.append('circle') // Create the circles
.attr('r', 25)
.attr('cy', 25)
.attr('cx', function(pos, index) { return pos }) // Use the position bound to the circle
.style('fill', function(pos, index) { return i % 2 == 0 ? 'blue' : 'red' })
21 / 33

Exercise 1

Use the starter code provided here, and modify it so that it:

  • The circles have the radii in the array
  • The circles are blue if the radius <= 30 and red otherwise

Refer to the previous slides for a syntax reference. (HINT: Only 2 lines need a modification.)

Before...
After...
22 / 33

D3.js: Handling mouse events

One of the greatest strengths of D3.js is its ability to customize the behavior of SVG elements in a page.

/* chain this code to the code from exercise 1*/
.on('mouseover', function (data, index) {
d3.select('[id="handling1"]')
.append('text')
.attr('id', 'label')
.text("This circle's radius is: " + data)
.attr('x', 20)
.attr('y', 120)
})
.on('mouseout', function (data, index) {
d3.select('#label')
.remove()
})
23 / 33

Exercise 2

Modify the code snippet so that the circle's size increase by a factor of 1.2 on "mouseover", and returns to its original size following the "mouseout" event.

Note: inside the "mouseover" and "mouseout" event, you can obtain the object corresponing to the target circle by selecting the this object with d3.select(this).

The result should look something like this:

24 / 33

Javascript Object Notation (JSON)

JSON is a data interchange format. It allows us to group and organize data.

A JSON document is simply a list of key-value pairs.

  
// Accessing a value
var firstName = jsonObject.firstName;
var age = jsonObject["age"];
  
// A JSON object reprenting a person
{
"firstName": "John",
"lastName": "Smith",
"isAlive": true,
"age": 27,
"address": {
"streetAddress": "21 2nd Street",
},
"phoneNumbers": [
{
"type": "home",
"number": "212 555-1234"
}
]
}
25 / 33

D3.js: working with scales and axes

When dealing with data, you will typically want to position/scale the elements in a visualization based on their value:

  • Heights in a bar chart
  • Position in a box plot
  • etc.
102030405060708090100110120130Time spend coding in a day (mins)

Let's do it.

26 / 33

D3.js: using paths to draw line charts

Using the d3.scale function, D3.js can determine how and where to draw a path for your data.

var data = [{x:1, y:30}, {x:2, y:20}, {x:3, y:3}, {x:6, y:8}]
// Code for creating scales go here
var line = d3.line()
.x(function(data) { return xScale(data.x) })
.y(function(data) { return yScale(data.y) })
var points = d3.select('#playground')
.selectAll('.point')
.data(data)
.enter()
.append('circle')
.attr('cx', function(d) { return xScale(d.x) })
.attr('cy', function(d) { return yScale(d.y) })
.attr('r', 10)
.style('fill', 'blue')
var line = d3.select('#playground')
.append('path')
.datum(data)
.attr('d', line)
.style('fill', 'none')
.style('stroke-width', 3)
.style('stroke', 'blue')
27 / 33

Customize your visualization to your liking

Here are other examples of features that D3.js enables:

28 / 33

How I use D3.js in my research

I have used D3.js extensively (at least 3-4 projects that have or are on track to be published):

  • MethylSight
  • SAANS Annotation App (React-Native mobile application)
  • Presentations (such as this one, see Remark.js)
29 / 33

Live demo

Let us consider a scenario where we were asked to build a visualization for the 2015 Canadian elections. We wish to allow the user to view the total vote per major party (PLC, CPC, NDP, Bloc Quebecois and Green Party).

We are given the following:

  • The total number of votes per party per province
  • A JSON file containing the coordinates of all the provinces' borders

Let's build this.

30 / 33
Boring and static plots do not do your research justice...
31 / 33
Boring and static plots do not do your research justice...
Why not use D3.js?
32 / 33

Thank you!

francoischarih@sce.carleton.ca

Slides will be available at http://www.charih.ca.

33 / 33

What is D3.js?

Data-Driven Documents

D3.js is an open-source Javascript library that provides a convenient interface for building data visualizations in the browser.

Created by Mike Bostock, a graphic designer at the New York Times.

1 / 33
Paused

Help

Keyboard shortcuts

, , Pg Up, k Go to previous slide
, , Pg Dn, Space, j Go to next slide
Home Go to first slide
End Go to last slide
Number + Return Go to specific slide
b / m / f Toggle blackout / mirrored / fullscreen mode
c Clone slideshow
p Toggle presenter mode
t Restart the presentation timer
?, h Toggle this help
Esc Back to slideshow